Global warming in December

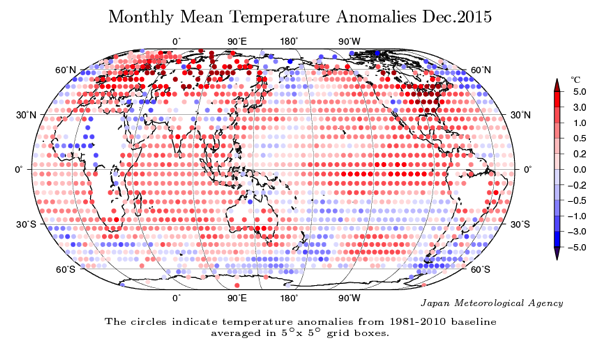
As the graph from the Japan Meteorological Agency above shows, global warming last month really did blow the previous record for December right out of the water — which was astonishingly warm itself (speaking of the oceans here), as the underlying image suggests.
The graph shows how the global average temperature in December, measured across land and sea surfaces, varied from the long-term average for the month. By the JMA’s calculation, it was 0.67°C above the 1981-2010 average, and 1.05°C above the 20th century average — the warmest by far since 1891.
There is no question that exceedingly warm waters along the equator in the Pacific Ocean contributed to December’s record warmth for the month. These are associated with the ongoing super El Niño.

But the map also shows that other parts of the Pacific were exceedingly warm too, as was the entire Indian Ocean and parts of the Atlantic.
On land, the remarkable warmth experienced across the eastern half of the United States really stands out. And look at that swath of red from Europe all the way across Russia.
I think this graphically illustrates a sobering fact: El Niño’s impact is coming on top of significant global warming from human activities.
No comments:
Post a Comment